Is your Facebook ad report up to snuff? Learn the top metrics you need to add to your report and how you can automate this time-consuming task in our guide.
Creating a Facebook ad report is a lot like writing a novel in that you're creating a story about a moment in time. Without all the right pieces in the right place, your story might lean more toward fiction than you (or your clients) would like.
In this guide, we'll cover the top metrics you need in your Facebook ad report, the best tools for creating one, and how to save yourself time by automating them.
The best Facebook ad metrics to track for your report
Given that there are around 100 different Facebook ad metrics to choose from, creating a report that captures every single metric would be a lengthy and time-consuming project in the best-case scenario.
In our opinion, there are at least 8 metrics you should always include in your Facebook ad report:
1. Amount spent. This one is pretty clear-cut: it represents the total spend for all the campaigns included in your report.
2. Unique outbound clicks. Unique outbound clicks represent how many people clicked a link in your ad that directed them outside of Facebook—aka to your website.
While you might be inclined to look at the link clicks or clicks (All) metrics, these can include clicks on your image or even engagement clicks (likes, etc.) and count the total number of clicks that happen. Using unique outbound clicks is a much better representation of how many people raised their hand to take the next step forward with your brand.
3. Outbound CTR. Just like with the previous metric, we're going to use outbound clicks for another important metric—outbound click-through rate.

The outbound CTR (for short) looks at the number of people who have clicked links that led them off of Facebook, divided by the number of times your ad was seen (impressions), expressed as a percentage.
4. Cost per add to cart. For eCommerce advertisers, looking at the cost of each step of the purchase sequence is vitally important to ensuring your purchase funnel runs as smoothly as possible. This is why our next metric is cost per add to cart.

The cost per add to cart metric represents the total amount spent (during the time frame of your report) divided by the number of add to cart events that were triggered by your Pixel or SDK setup.
It's important to note that unless you have added additional tracking measures to prevent the data loss issues that happened after the iOS 14 changes, this number can be significantly lower than your actual add to cart numbers. This will be the same for the other metrics on our list that involve Pixel/SDK tracking.
Note: If you want to take the hassle out of tracking, you can utilize Madgicx’s Cloud Tracking Service and get a reliable tracking setup in just 2 days.
5. Cost per checkout initiated. After adding an item to the cart, the next step in the purchase sequence is initiating checkout—which is also the next metric we need to track.

Similar to cost per add to cart, this metric is calculated as the total amount spent during the time frame selected, divided by the number of checkout initiated events triggered by the Pixel/SDK.
6. Cost per purchase. Cost per purchase should be a no-brainer for eCommerce advertisers—after all, you need to know how much money it costs to generate a single sale to keep your ad efforts in the green.

The cost per purchase is the total amount spent during your selected time frame, divided by the number of purchase events triggered by the Pixel/SDK.
If you think I'm about to mention iOS 14 again, you're totally right. Just like any metric based on the Pixel/SDK, this number can be smaller than it should be due to data loss.
7. Offline Purchases. One of the ways you can combat your data loss is to upload your conversion data directly into Facebook manually via offline conversions or automatically using the offline conversions API.
In that same vein, you'd also want to track your offline purchases (aka purchase events you added with either of these methods). This should supplement your purchase conversion data.
8. ROAS. Return on ad spend (or ROAS for short) should be one of your guiding stars when it comes to Facebook ad reporting. The reason is that ROAS looks at the actual amount of money you made instead of simply the number of purchases.

ROAS is a calculation based on your revenue divided by the amount you spent during that timeframe.
For example, if we have gained $20k in revenue for a campaign that only spent $5k, our ROAS is 4— meaning for every $1 we spent, we made $4.
Note: There are other important metrics to track (as well as some you can ignore entirely)— you can read our guide on Facebook ad metrics to learn how to create an in-depth report to satisfy even the most curious minds.
Now that you know what you should be tracking, it's time to dive in and create a report. There are a few Facebook ad reporting tools that can make our lives a bit easier.
Facebook ad reporting in the Ads Manager
The first one you might think of (and rightly so) is the ad reporting available inside of Facebook.
To get to this feature, just head over to Ad Manager and select the report dropdown from the right-hand side of the screen.
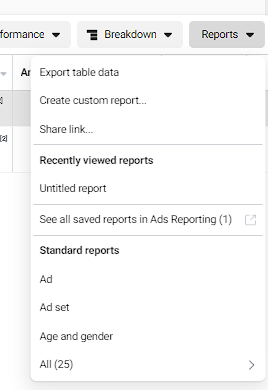
From here, you can choose to export your current layout as a report or create one from scratch.
There are some standard reports (25 in total) that come pre-baked here. That being said, there aren't any that encompass all the metrics we recommended above, so you'll need to customize your own report if you wish to follow our advice.
Once you select the option you want to go with, you'll be brought to the reporting page. You can use the options on the right-hand side of the page to add custom metrics or breakdowns to your Facebook ad report.
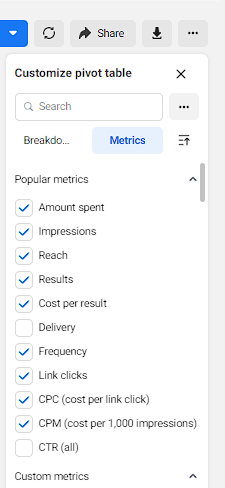
It's also important to note that while the report itself is set to a default pivot table, you can turn this into a line chart or bar graph using the toggle on the upper left-hand side of the screen.
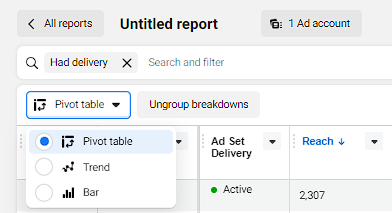
Once you have your report created as you see fit, it's time to export it. If you're looking to share this report outside of Facebook, you can choose to download your report as:
- Formatted or raw data table (.xlxs)
- .csv
- Image (.png)
Here’s a sample of what a completed Facebook ad report looks like in Excel once exported:
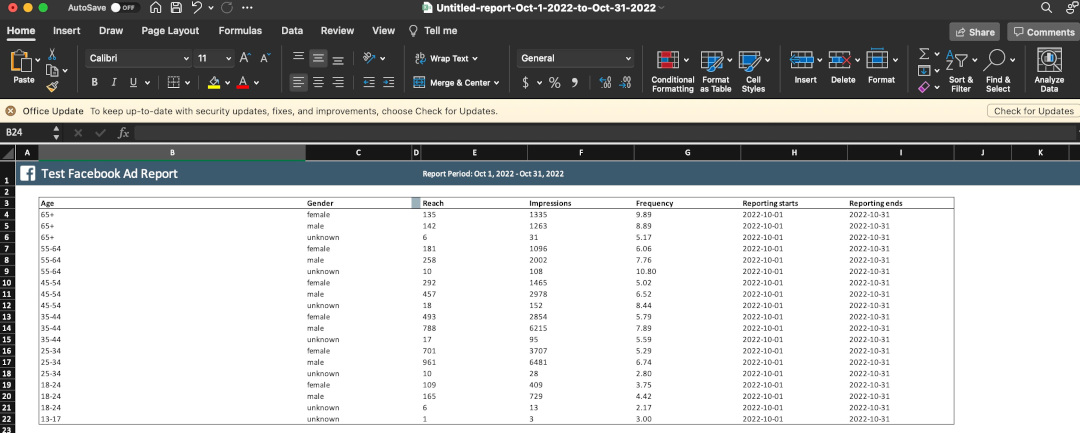
You can also choose to automate this report entirely by sending it to anyone who has access to view it. This feature is a bit more hidden and requires you to click the icon next to the report name to see it.

After clicking it, you'll see a popup with a few options, including attribution and currency. However, the feature we're looking for is 'schedule email.'
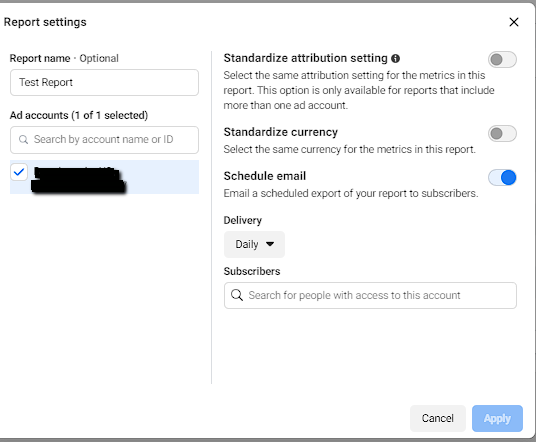
At this step, you can choose to send your report either monthly, weekly, or daily as well as choose who to send that report to.
A word of caution: If you're sending this to your clients daily, chances are they might be fearful of seeing the daily fluctuations of Facebook ads as they can be quite volatile. We'd recommend only sharing a weekly or monthly report in order for them to get a better overall performance review, while you can keep a daily report for optimization.
And that's it for the Facebook ad report tool. While it's good for some stock reports, it's overall pretty simple and doesn't offer as much customization or features as other tools on this list.
Facebook ad reports on Google Data Studio
A lot of marketers love Google Data Studio, and for a good reason.
With Google Data Studio (now called Looker Studio), you can connect data from your entire tech stack (ad platforms, CRMs, you name it) and create customized reports in nearly every format that you can think of and combine them into one page.
Unfortunately, most of this will be very manual (as you'll see in a second) unless you pay for automated connectors like Supermetrics. However, this tool might be useful for those who want to see data from different platforms in one place.
Let's run through how you can create your Facebook ads report for free with Google Data Studio via a Google Sheet.
The first thing we need to do is head over to our Facebook report that we created earlier and download it as a .csv.
Then, head over to Google and create a new sheet with this data. You can go to File>Import to import that file and speed things up.
Next, we're ready to use Google Data Studio. After you add your company name and continue, you'll want to first start off by adding your data source (which will be our Google Sheet). To do this, click “Create” and then select “Data source.”
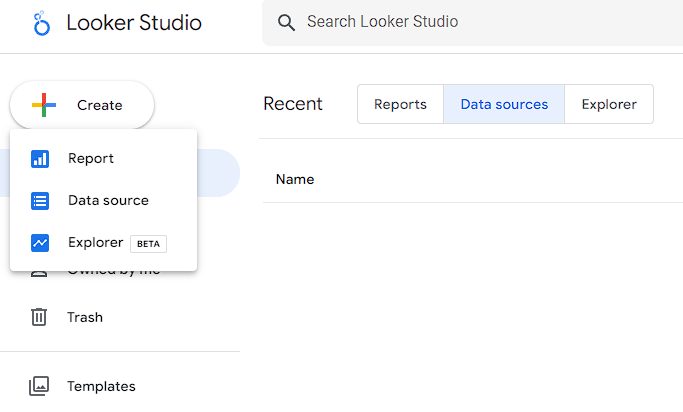
Then, select Google Sheets as a source. You'll need to authorize your Google account to do so, but once you have, you'll be able to select the specific sheet you just created and any tabs if there are multiple.
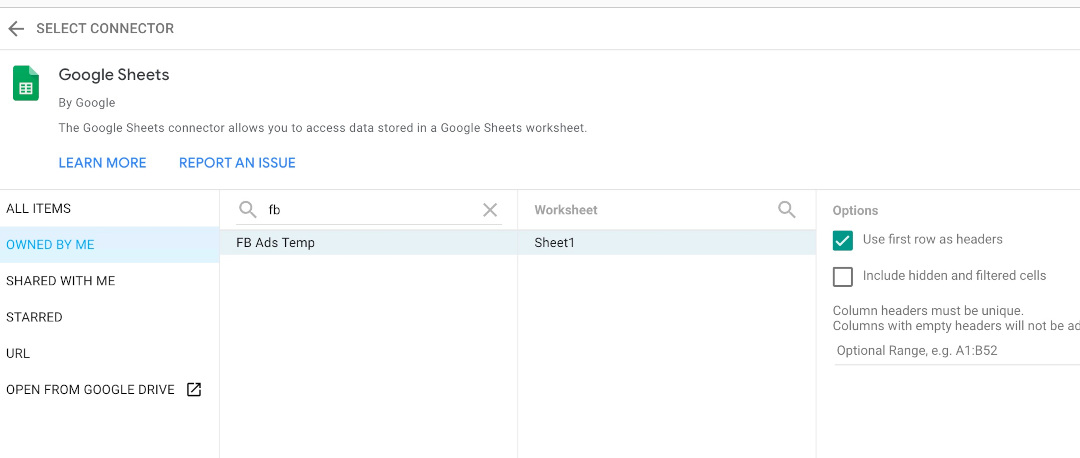
Once you select it, there may be a few fields you need to map. For example, date fields should be mapped as such instead of numbers as they will initially appear. After you've done this, you can click “Create Report” on the top right-hand side.
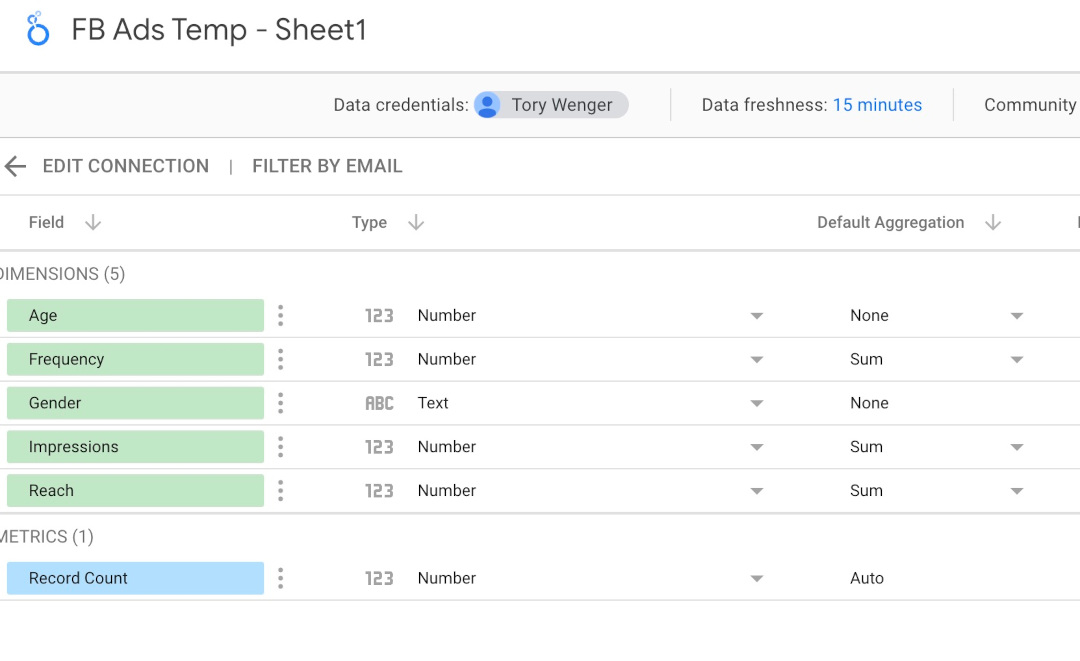
Now that your data is inside Google Data Studio, you can use its full set of tools to create your report as you'd like. Another benefit is that as you update the sheet, GDS will also update the metrics, so you won't need to create the report over again.
Here’s a short sample of what you can create in GDS:
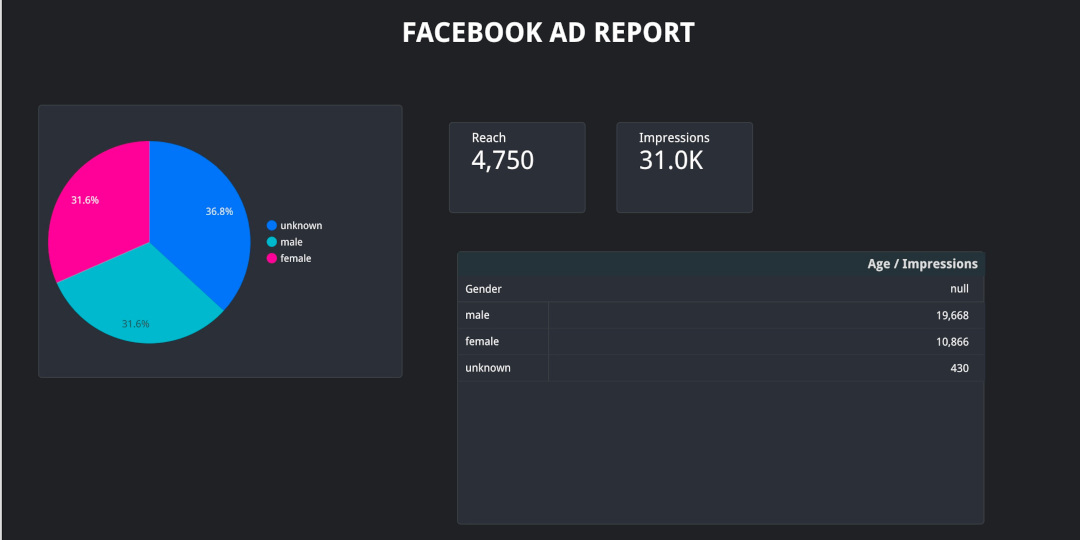
Although Google Data Studio has a steep learning curve, you'll find you can create any type of report you can think of, as well as combine data from any other source using the same method.
Generate your reports with Madgicx's One-Click Report
So far, we've seen two options for Facebook ad reporting tools, the plain and simple and the highly customizable but incredibly difficult angle.
Now it's time to find the perfect solution once and for all—Madgicx's One-Click Report.
With Madgicx's One-Click Report tool, you can:
- Use the tool as your primary dashboard to get a clear view of your day-to-day performance across different advertising channels (Facebook, Google Ads, Google Analytics 4, TikTok, and Shopify)
- Create professional-looking and useful reports as a small or medium-sized business without spending huge money on data analysts (which look more professional than Facebook's bland report)
- Take advantage of Facebook ad-specific templates to gain insight into what metrics the industry leaders look at and how they organize their reports
- Quickly share your data with clients and co-workers without the hassle of ad permissions
If all that weren't enough, Madgicx also offers additional options that even Facebook doesn't have:
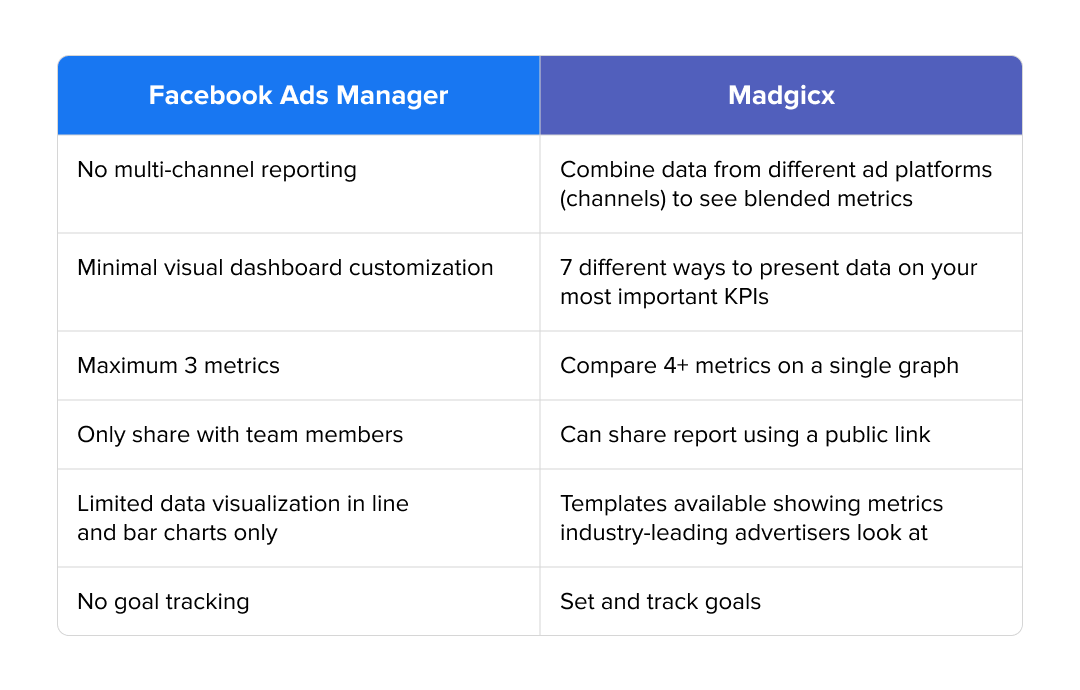
To get started, all you need to do is connect your data source to Madgicx during your free 7-day trial and create your 5 free reports. As we mentioned, Madgicx supports Facebook as well as Google Ads, Google Analytics 4, TikTok, and Shopify, so make sure to connect everything you need.
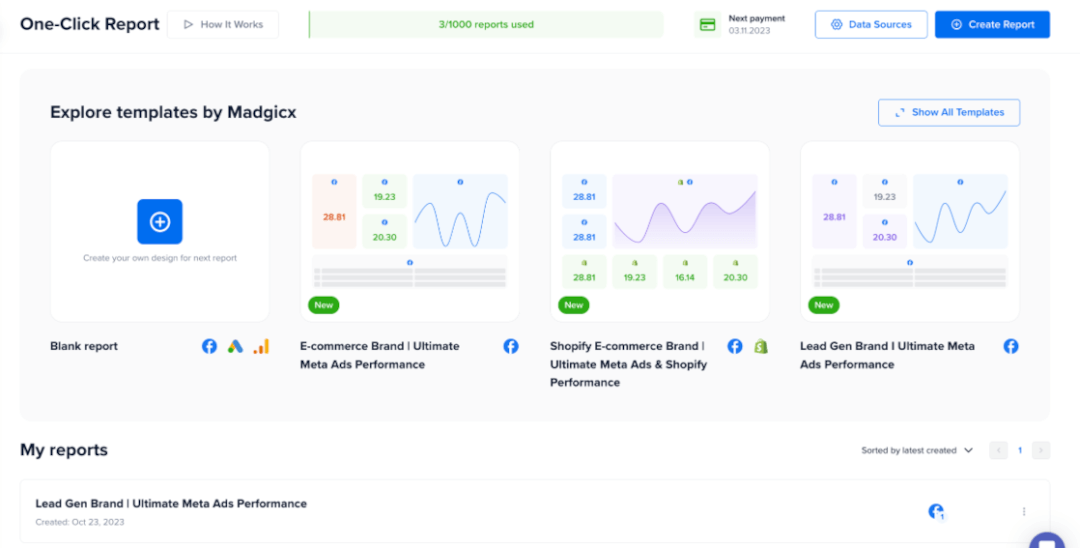
Next, head over to the One-Click Report on the left-side menu.
Once you click “Create New Report,” you'll find 19 unique templates depending on what you need out of your report and what data source you want to use. You can choose to focus on just one platform (Facebook, for example) or create a multi-channel report.
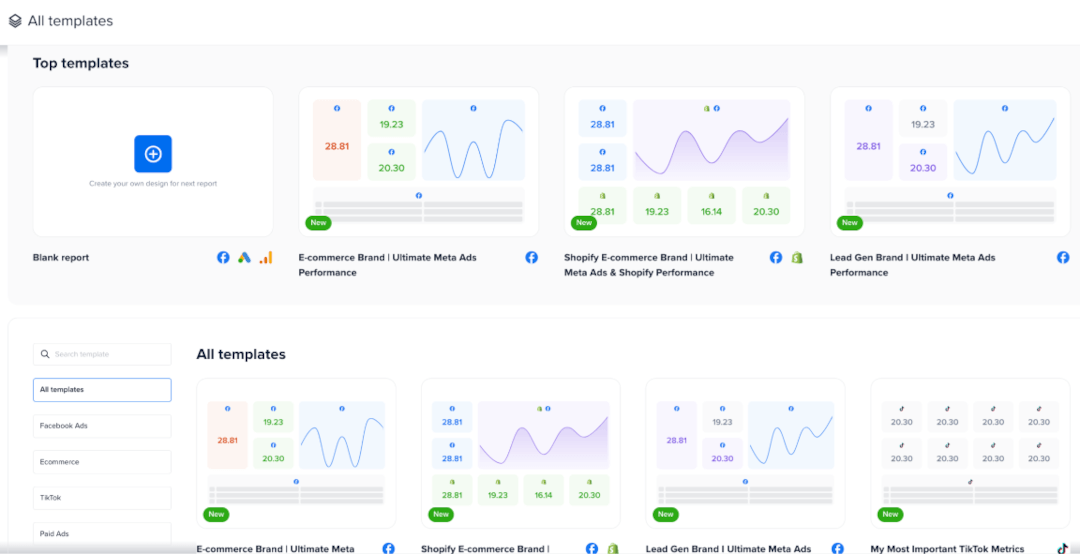
Once you've selected the template you like, you can choose which ad accounts you'd like to report on (one or more) and then view your final creation.
If you want to switch up your metrics or even add some of your own, you can easily do that inside the tool by clicking on the plus icon on a blank square and adding your widget as needed.
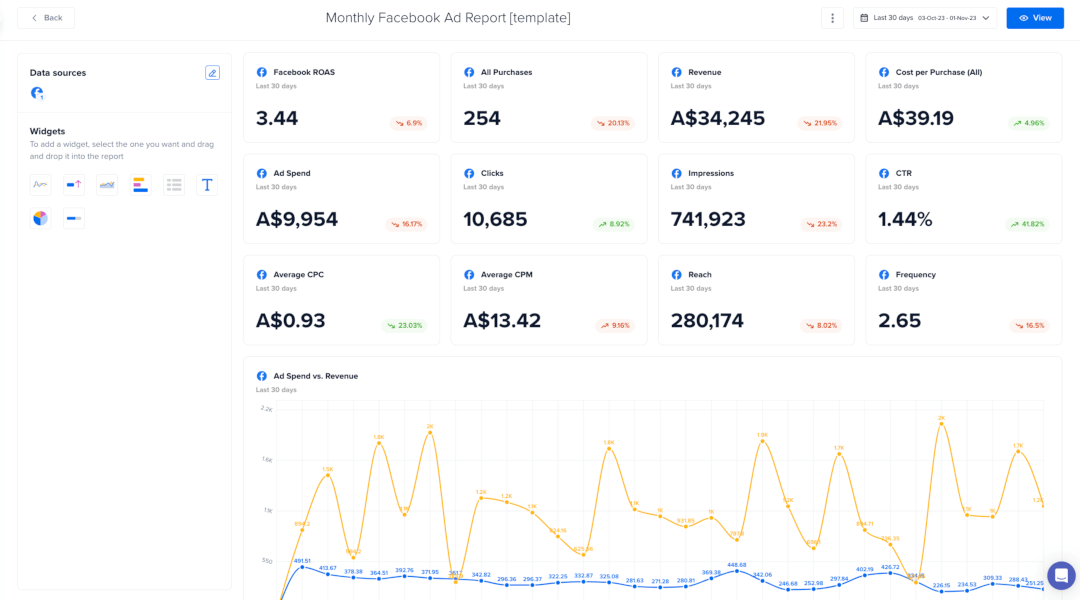
Although, with such a complete report already, chances are you won't have to, ;)
The best Facebook ads templates to simplify your reporting
Creating a report from scratch is no easy feat—and that goes double if you want it to look good. For that reason, we recommend using a premade template from Madgicx.
While all our templates are designed with specific goals in mind, there are 2 templates that can be used for every industry and situation - the Facebook Ad Performance Overview and the Monthly Facebook Ad Report.
Facebook Ad Performance Overview
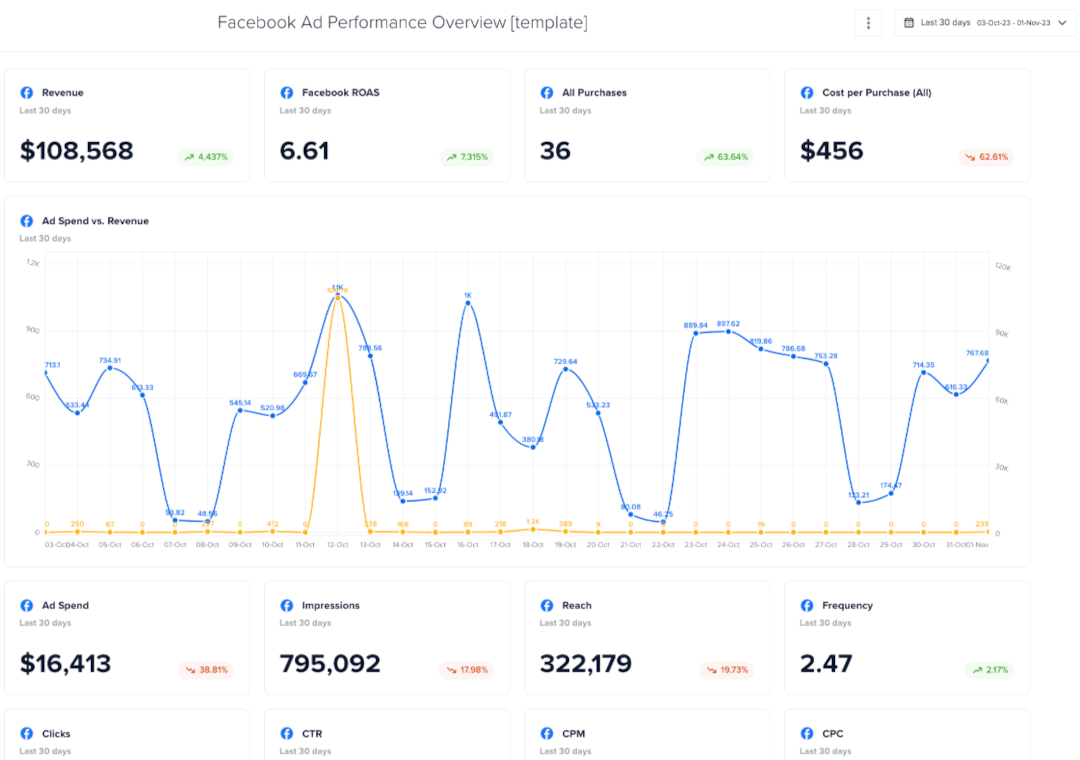
First up is the Facebook Ad Performance Overview template. This overview is a great way for you to track the metrics that matter most to your performance and see how they compare to the previous time frame (the default is 30 days).
All in all, this is a great report for diving into some of the more detailed performance insights you may need.
The Monthly Facebook Ad Report
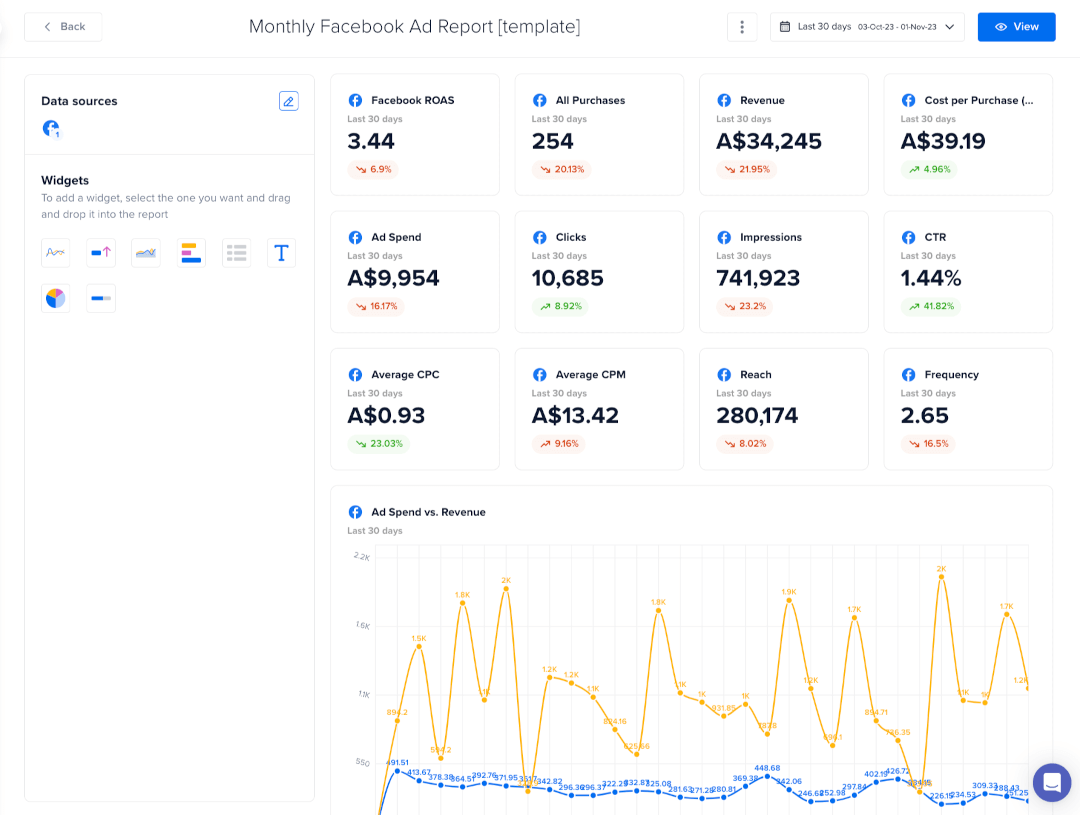
The Monthly Facebook Ad Report, as the name implies, is a general monthly overview report. If you’re looking for a standard report that covers all the top metrics and is easily shared and understood by clients and marketers alike, this is your ticket.
How to share your reports with clients
Once you're all finished with your report, you can share it in one of two ways—either with a public link they can use to view the report via their browser (no Madgicx account required!) or via a PDF file.
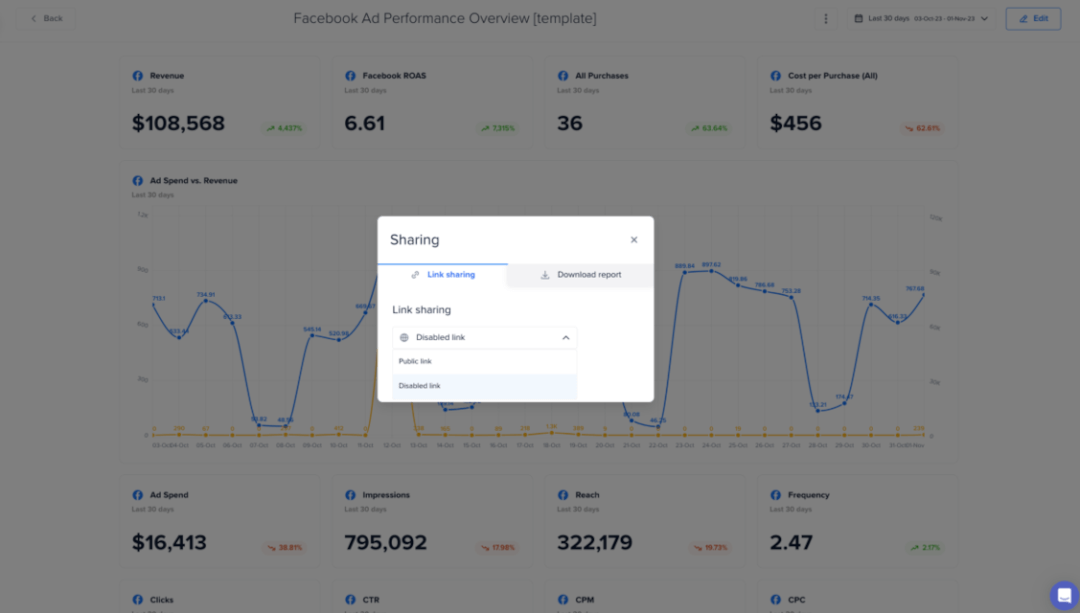
You can also choose to automate this entirely by sending your report monthly, weekly, or daily. Just like we mentioned before, you should stick to either monthly or weekly reporting for clients.
Conclusion
Today we've learned what metrics you need to track in your Facebook ad report, as well as 3 different tools you can use, and even how to automate your reporting blues away.
All in all, we recommend automating your reporting as much as possible (for yourself and your clients) so that you can make room for higher-level strategy and optimization decisions that truly impact your ad performance.
Knowing your Facebook data is one thing; understanding your overall ad performance is another. Madgicx’s fully-customizable reporting tool lets you track your top metrics from all ad channels in real time.
Tory is a digital marketing specialist and the current Marketing Manager of Breadcrumbs.io. She's been featured in various high-profile marketing blogs like Hootsuite, AdEspresso, and Databox and holds certificates for both Google and Facebook Ads. In her spare time, she gardens and paints from her house in the Florida panhandle.


