Stop flying blind. Learn how to use digital marketing dashboards to align your teams, exceed your KPIs, and increase your marketing efficiency with this guide.
In today's data-driven world, understanding and leveraging the power of data is a non-negotiable for marketers.
Unfortunately, being able to gather and analyze that same data is harder than it seems.
In this article, we will delve into the multifaceted (and helpful) realm of digital marketing dashboards. From unraveling the process of choosing goals that align with your business objectives to handpicking the right metrics to keep an eye on, we’ve got you covered. We'll also show off 4 dashboard examples so you can see the best practices in action.
The icing on the cake? A curated list of the top 4 digital marketing dashboard tools that are making waves in the industry.
Whether you're a seasoned marketer or just getting your feet wet, this article is your compass to navigating the sea of data with finesse. Strap in as we embark on the journey to data enlightenment!
What is a digital marketing dashboard?
Digital marketing dashboards are user-friendly interfaces that visually present key performance indicators (KPIs), metrics, and data related to digital marketing efforts. They are tools for organizing, tracking, and analyzing data from various digital marketing channels in real time, allowing marketers and business owners to gain insights into the effectiveness of their marketing strategies.
There are a few big reasons why using a digital marketing dashboard is essential in 2023:
They give you access to all your data in real time. Dashboards allow businesses to track the performance of their marketing campaigns in real time, helping to identify trends and make adjustments as the need arises.
They're a conduit for data-driven decision-making. By presenting data in an easily digestible format, digital marketing dashboards enable businesses to make informed decisions based on actual performance data rather than relying on gut feelings or assumptions.
They save time. Collecting and analyzing data manually can be time-consuming and tedious, especially when working with a complex tech stack. Dashboards automate this process, which saves time and allows teams to focus on more strategic tasks.
They provide access to benchmarking and forecasting data. Dashboards help in setting benchmarks and goals for marketing campaigns. By continuously monitoring these KPIs, businesses can measure success and make necessary adjustments to meet objectives.
They act as a single source of truth. Digital marketing dashboards can improve communication within a team or organization by providing a shared view of marketing performance. This ensures that everyone is on the same page regarding the status, metrics, and results of each marketing initiative.
Setting up the right metrics
You can have the fastest car on the planet, but unless you have a destination in mind, all that horsepower won't do you any good. The same goes for your marketing dashboards.
In this next section, we'll show you how to choose the right goals and metrics to track so you're prepared when deciding which platform you want to use for your dashboard reporting.
Defining goals for your digital marketing efforts
Before you select the specific metrics you want to track, you first need to figure out what your main marketing goals are. The metrics you select to track should be ones that help you achieve this specific goal.
If you're having trouble coming up with an overall goal, here's a little framework to help you:
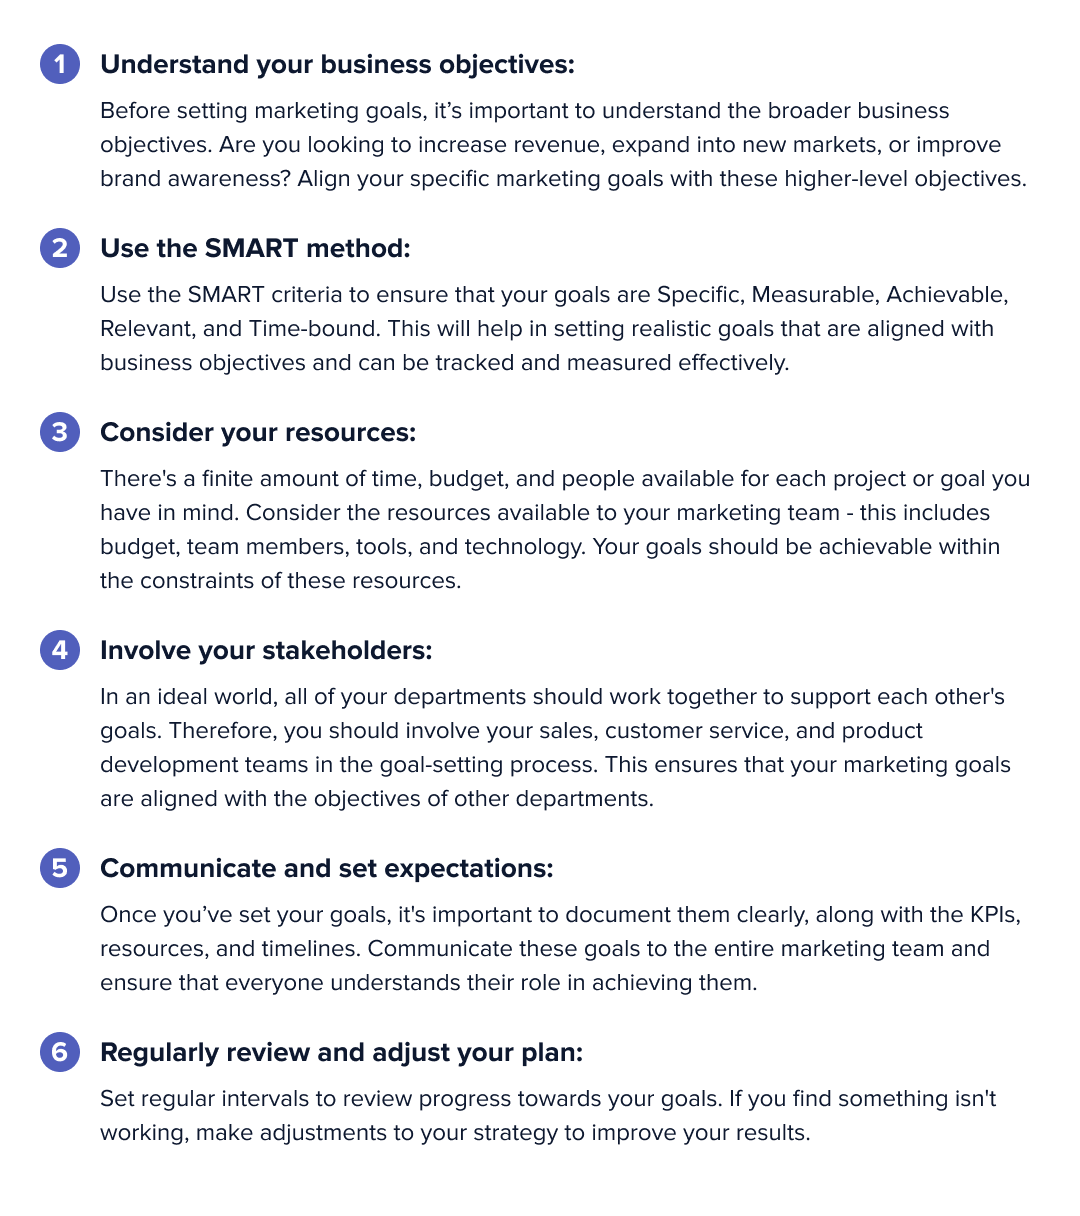
Using this framework, you should be able to create and implement your new goals in no time.
Selecting the right metrics for your business
Once you've selected your overarching goals, it's time to choose the metrics that you'll use to measure your progress toward them.
Before we go on, it's important to note that there are about as many metrics in marketing as there are stars in the sky. As you'll find, some you need to monitor regularly, some are important enough to consider KPIs, and some you probably won't focus on or use at all.
That being said, there are a few metrics that absolutely every marketer must know about and regularly monitor to keep the pulse on their goals.
Commonly used metrics in digital marketing dashboards
- Website Traffic: This refers to the number of visitors coming to your website. It's crucial to also break it down into sources like organic, direct, social, referral, and paid traffic.
- Conversion Rate: Conversion rate is the percentage of visitors who complete a desired action (such as making a purchase, signing up for a newsletter, or filling out a contact form) compared to the total number of page views.
- Bounce Rate: This is the percentage of visitors who leave your website after viewing only one page. A high bounce rate may indicate that your landing pages or web pages are not engaging or relevant to visitors.
- Cost Per Click (CPC): In paid advertising, CPC is the amount you pay each time someone clicks on your ad.
- Return on Investment (ROI): ROI calculates the profit made from your marketing campaigns relative to the cost of those campaigns.
- Click Through Rate (CTR): This is the ratio of users who click on a specific link (such as an ad or email link) to the number of total users who view the page, email, or ad.
- Customer Lifetime Value (CLV): This measures the total revenue that a business can expect from a single customer over the duration of their relationship with the company. It helps in understanding the long-term value of acquiring new customers.
- Social Media Engagement: This includes metrics like likes, shares, comments, and follows on social media platforms.
- Email Open and Click Rates: For email marketing, the open rate is the percentage of recipients who open your email, while the click rate is the percentage of those who click on links within the email.
- Cost Per Acquisition (CPA): This measures the average cost to acquire a customer through a specific marketing campaign or channel.
Each of these metrics provides valuable insights across all of your marketing channels. Regularly monitoring these key marketing metrics on your dashboard will make you one step closer to hitting those goals out of the park.
Essential features of a digital marketing dashboard
Shopping for tech tools is a lot like dating: if you're not specific with what you need, you can end up stuck with something that can't scale with you long-term.
And with the ever-increasing pressure from your mother CMO to get it right the first time, you'll want to do your due diligence when testing out your dashboard software.
Here are a few of my recommendations for what to look for in your marketing analytics software:
- It can report on all the metrics you need.
- It features graphs, charts, and tables to present data in an easily digestible format.
- It allows users to select different time periods for data analysis. This is important for identifying both short-term and long-term trends.
- It can segment data based on various criteria such as location, demographics, or source. This helps in understanding the performance of specific segments of a marketing campaign.
- It integrates with your current tech stack without the need for third-party apps like Zapier.
- It allows users to customize its layout and choose which KPIs to display
- It allows for different report access levels and collaboration. This helps in sharing data and insights within the team (or externally to clients) effectively.
Top digital marketing dashboard tools
With all the basics out of the way, we can now focus on the important part: selecting the right digital marketing dashboard tool for your organization.
Here are a few of the top performers in the category to save you some valuable research time.
One-Click Report
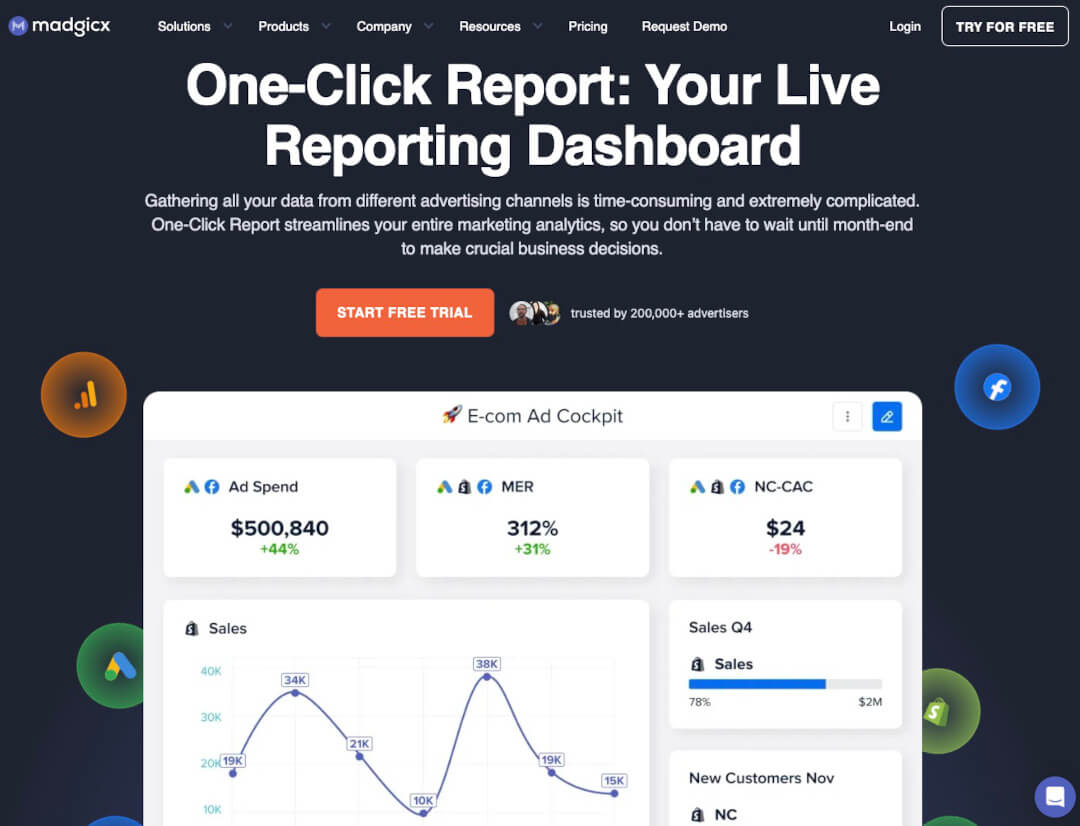
At Madgicx, we know a thing or two about what it takes to create a superstar digital marketing dashboard. In fact, we created our own reporting powerhouse called the Madgicx One-Click Report.
With just a click, One-Click Report is capable of presenting easy-to-digest reports and dashboards across Facebook, Google, TikTok, and Shopify, all in one place so you can make data-driven decisions as issues arise.
Not only does the One-Click Report boast an impressive 11 pre-made templates perfect for any goal, but you can also customize them to add any metrics you need by dragging and dropping them with ease. You can then share these reports with your team or clients without needing a Madgicx account for them.
Less money spent on seats = more money to spend across your marketing campaigns. Moreover, One-Click Report allows you to add as many ad accounts across as many channels as you like - at no additional cost!
And while you might think all of these features come with a hefty tag, you'd be completely wrong. You can get access to all the One-Click Report has to offer starting at $29/month.
Google Data Studio (AKA Looker Studio)
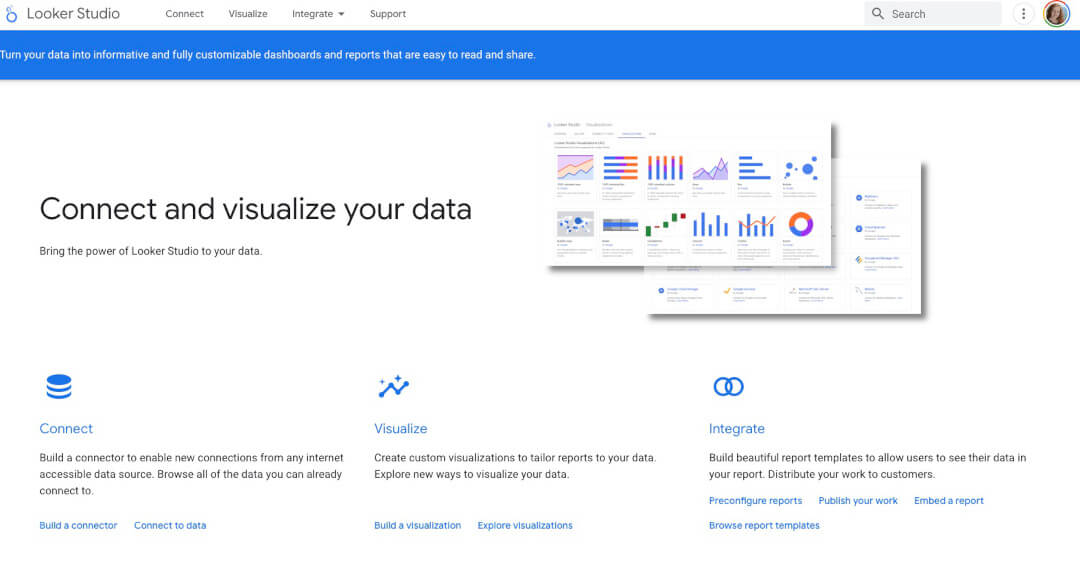
Next up is Looker Studio (formerly Google Data Studio). This is a free tool provided by Google to help you create reports across the Google product suite as well as 812 other popular platforms.
Looker Studio is Google's rebranded and enhanced Data Studio tool aimed at self-service business intelligence.
Looker Studio offers an easy-to-use interface, a library of report templates, data connectors, an API, and report embedding options, and it hits all the key points we outlined above.
While the tool is available in a basic free version, unless you're a developer who can build a custom integration to your platforms, you'll likely need to purchase additional subscriptions from one of the partners, like SuperMetrics, to get your data added to your dashboards.
There is a paid version called Looker Studio Pro, which offers enterprise management, collaboration features, and Google Cloud Customer Care support. However, the pricing of the Pro version is not transparent and is hidden behind a demo CTA at the time this article was published.
While Looker Studio does hit all the key points we're on the lookout for, the template editing process is quite convoluted and difficult to work with—meaning setting up the reports will take significant time and energy and might require the help of a professional analyst.
Databox
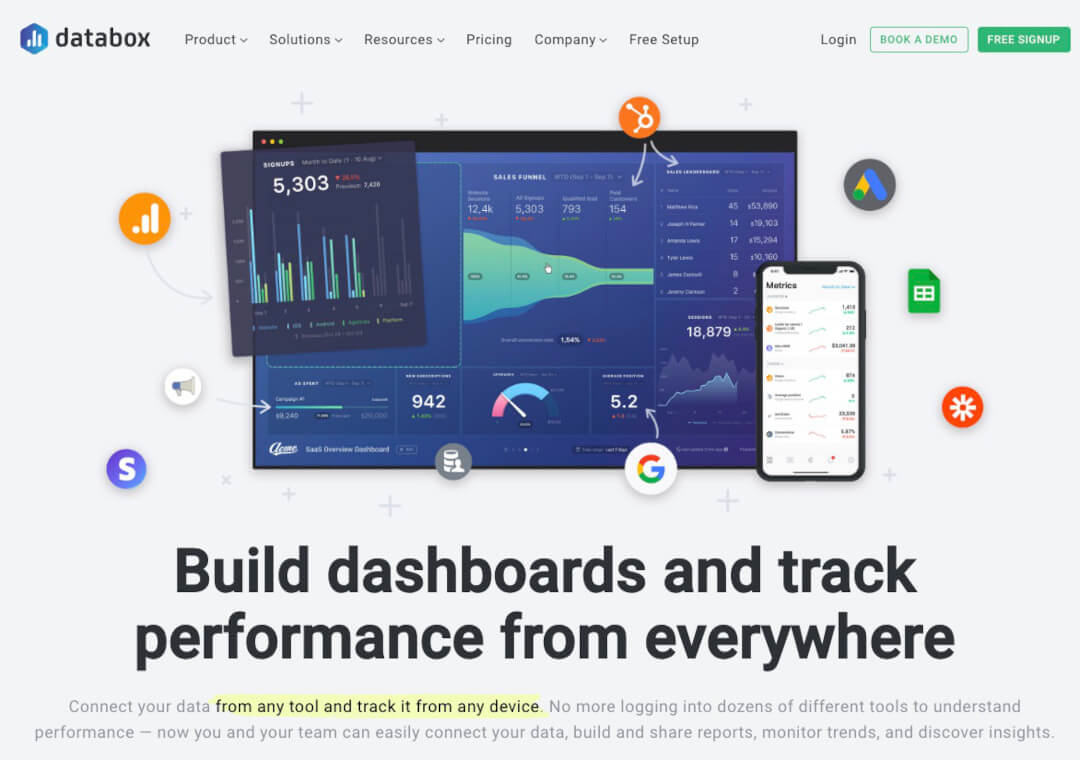
Databox is a business analytics and data visualization company that helps businesses monitor and analyze their performance data.
The platform pulls in data from various sources like Google Analytics, social media, CRM systems, and marketing automation tools and presents it in real time through interactive dashboards. Users can customize these dashboards, known as “Databoards,” to track the metrics that matter most to them.
Databox allows for goal setting and provides alerts and insights to help users understand how their business is performing and where improvements can be made. It aims to make data analysis accessible and actionable, even for those without a technical background.
Databox can be accessed on multiple devices, including smartphones and tablets, enabling businesses to stay informed and make data-driven decisions wherever they are. Its functionalities cater to marketers, sales teams, executives, and other professionals seeking to harness the power of data.
Databox's pricing is based on how many users and dashboards you need, as well as how much historical data you need to be able to retrieve and how often you need the data updated. Pricing ranges from $0/month to $799/month for Enterprise organizations.
Klipfolio
Klipfolio is a cloud-based data analytics and business intelligence platform that enables businesses to create custom dashboards for monitoring real-time performance metrics.
Through its user-friendly interface, users can connect to various data sources like databases, applications, and spreadsheets and create visualizations such as charts, graphs, and tables. Klipfolio’s dashboards, known as “Klips,” can be shared and accessed on multiple devices.
What sets Klipfolio apart from competitors like Databox is its high level of customizability. Users can use a combination of pre-built data connectors and custom scripts to connect to almost any data source. Additionally, Klipfolio tends to focus more on real-time data, which is beneficial for businesses requiring instant insights.
The platform is also known for its scalability, as it caters to both small businesses and large enterprises, and it offers more complex data manipulation capabilities for advanced users compared to some of its competitors.
Luckily, Klipfolio also features a free plan, and each plan allows for unlimited metrics and view-only users, which can be helpful for large teams. Klipfolio's pricing ranges from $0-$800 per month, depending on your needs.
Digital marketing dashboard examples
Since we now have all the necessary information on what makes a great digital marketing dashboard, let's take a peek at some examples that pull all of this great advice together.
Digital marketing dashboard example #1 - Know Your Audience
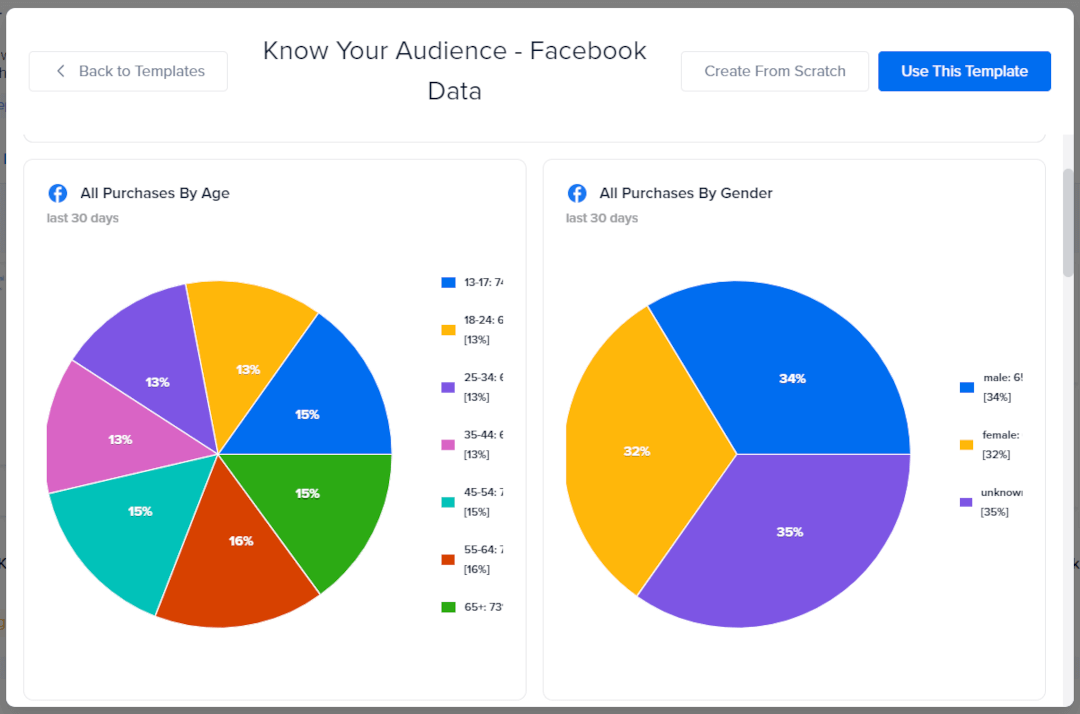
The worst mistake you can make in marketing is to ignore your audience. Therefore, you should always have a dashboard that gives you insights into the demographics of your audience so you can make better decisions about what language, imagery, and pain points resonate with them.
Some common breakdowns to add are age, gender, and location. For those in a B2B motion, you should also include firmographics like company size and revenue.
Digital marketing dashboard example #2 - Business Dashboard
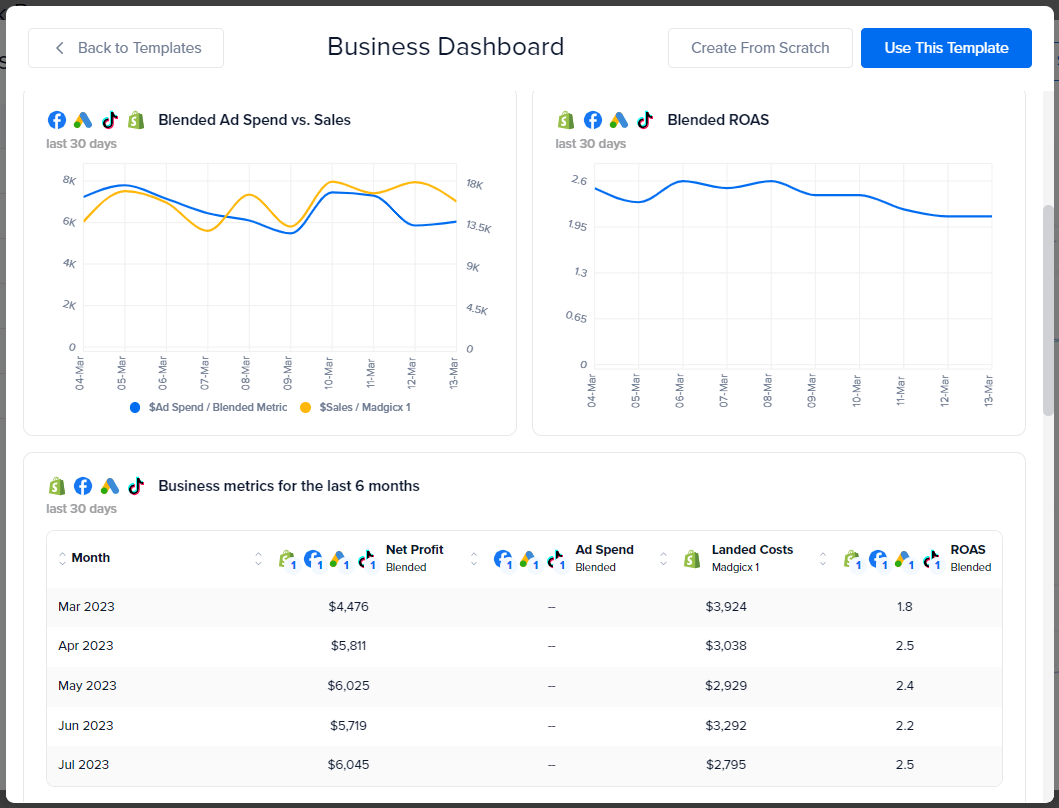
Doctors have heartbeat monitors to help monitor their patient's health, and likewise, marketers should have business dashboards to keep an eye on the pulse of their business.
Your business dashboard should be a tactical overview of all of your north star metrics, including (but not limited to) Net Profit, Number of Orders, Cost per Purchase, MER, and ROAS.
Digital marketing dashboard example #3 - Monthly Facebook Ad Report
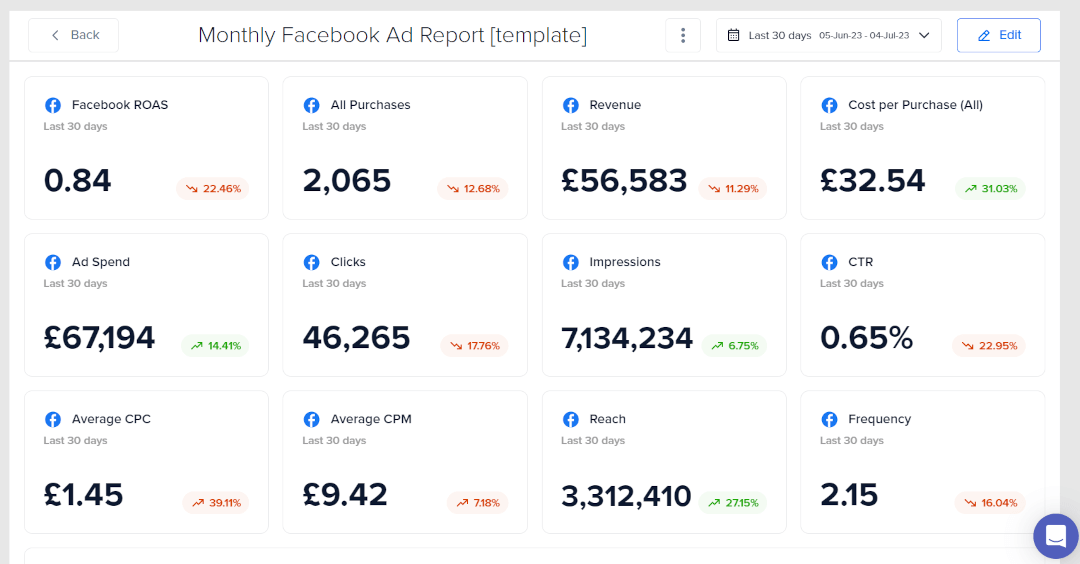
It's true that without keeping an eye on things, it's easy to lose a lot of money very quickly in advertising. This rule goes double (or even triple) for paid advertising.
Another dashboard that should always have a place in the digital marketer's tool belt is your Monthly Facebook Ad Report. This report should contain everything you need to analyze and optimize your Facebook campaign. Common metrics for this report include ROAS, CPC, CPM, Clicks, CTR, Cost per Purchase, and Frequency.
Digital marketing dashboard example #4 - Changing Metrics Over Time
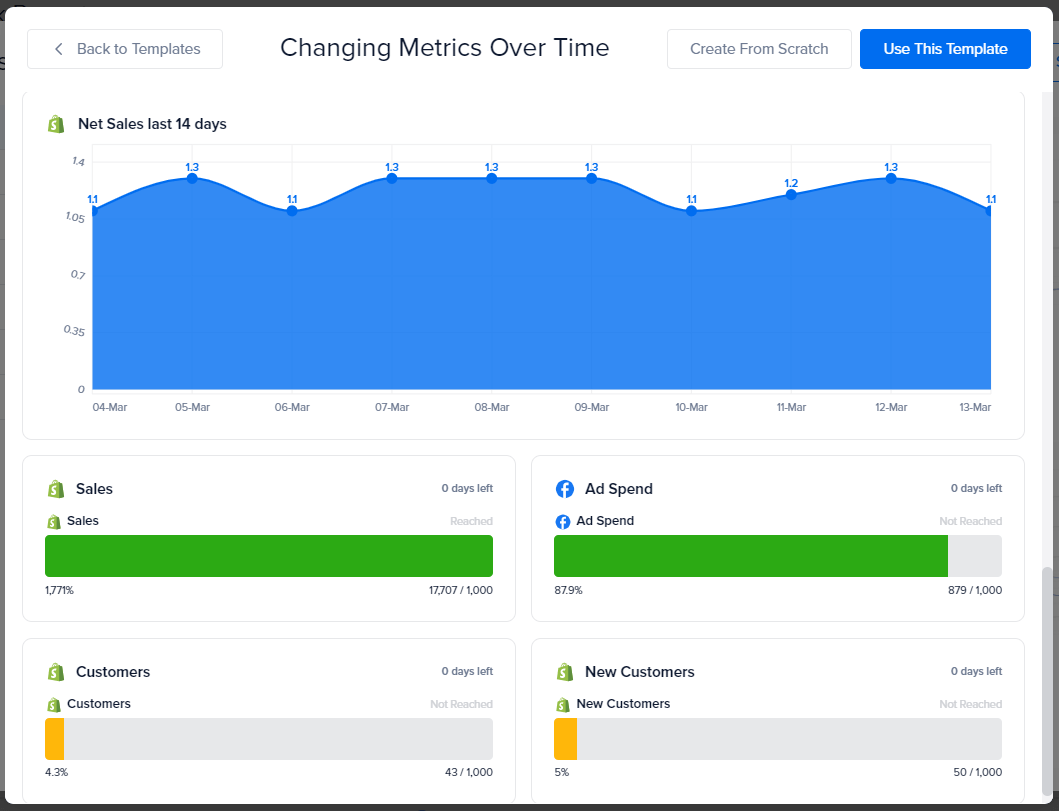
There are two things your CFO wants to know: how much money is coming in and how much is going out. With the Changing Metrics Over Time dashboard, you'll never have to give a confused expression when answering this question again.
This dashboard should include digital marketing metrics that relate to costs and profits and be able to display data on your profitability. Metrics for this report include Ad Spend, ROAS, ROI, Orders, and Sales.
Conclusion: getting the most out of your dashboard
As with any new endeavor, you can guarantee that it likely won't be perfect the first time around—and that's okay. The most important thing is to just get started.
By ensuring you're setting the right goals, tracking the metrics that impact those goals the most, and then keeping an eye on your progress, you'll be well on your way to creating a reporting nirvana your CFO, CMO, and CEO will be delighted with.
Unlock the full potential of your marketing efforts with One-Click Report—the ultimate solution to gain real-time insights, analyze, and optimize data. Say goodbye to guesswork and start making data-driven decisions to exceed your KPIs! 🚀📊
Tory is a digital marketing specialist and the current Marketing Manager of Breadcrumbs.io. She's been featured in various high-profile marketing blogs like Hootsuite, AdEspresso, and Databox and holds certificates for both Google and Facebook Ads. In her spare time, she gardens and paints from her house in the Florida panhandle.


